The Price of Gas
Interesting chart.
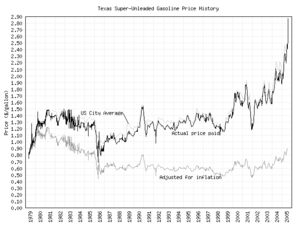
Stuart at Randomuseless.Info kept a record of the price per gallon for the last 26 years and presents it as a graph. He also includes the overall USA City Average numbers and the two track pretty well.
What is interesting is that the third line is the data adjusted for inflation.
Click for full-size Image
He provides the raw data if you want to play around with it yourself.
Right now, at $2.80/gallon, we are effectively paying $0.90 in 1979 dollars.
In 1979, gas was $0.80/gallon but quickly rose to over $1.30/gallon.
Carter was president from 1977 through 1981 so this was on his watch.
Under Ronald Regan, prices stabilized and began a decline. They have been holding quite stable up until recently.
Posted by DaveH at August 25, 2005 5:07 PM
