August 3, 2005
The rising Sea Level
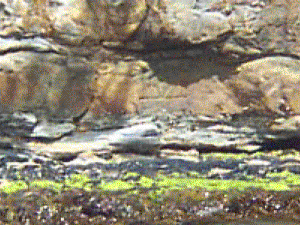
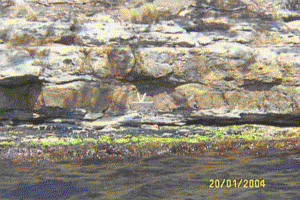
Someone on an email list linked to this story at CBC and bewailed: "Lord, here comes the flood" A brief excerpt from the CBC story:Collapse of Antarctic ice shelf could have global effectsFirst of all, if you visit the story, you will see that it does not carry a byline. No person is putting their name to this piece of erroneous piffle and fluff. It is a shame to see a fine institution like the Canadian Broadcasting Company fall for the current "Human Caused Global Warming" hysteria... They are saying firstly that an Ice Shelf in Antarctica called the Larsen B broke up because the glaciers that formed it were advancing too fast for it to withstand the strain. When that happened in 2002, a number of people were all-a-twitter until saner heads remembered that an "Ice Shelf" floats on the ocean water (it is formed when the glacier flows into the ocean) and just as a floating ice cube in your drink will not change the level in your glass as it melts, neither will the ice from an ice shelf displace seawater is it melts. The CBC article is now claiming that some bloviating, handwaving "researcher" is saying that since the glaciers are advancing faster, the increase of ice coming into the ocean will cause a rise in sea level and that this is caused by global warming. What they fail to realize is that temperatures have been cooler there and there has been an increase in precipitation. This has triggered an increase in glaciation. The precip comes from the surrounding seawater so although this water may take a couple-hundred-year vacation, no water is being added to the ocean. You are looking at a circulation of water: Ocean-->Air-->Precipitation-->Ice-->Ocean. For a wonderful examination of Sea Level change from 1841 to 2004, this picture is worth a thousand words:
The unprecedented collapse of an ice-shelf in Antarctic could indirectly lead to a significant rise in global sea levels, researchers say.


The 1841 sea level benchmark (centre) on the 'Isle of the Dead', Tasmania. According to Antarctic explorer, Capt. Sir James Clark Ross, it marked mean sea level in 1841. Photo taken at low tide 20 Jan 2004. Mark is 50 cm across; tidal range is less than a metre.Let's read that again and consider four things #1) - the mark was placed at mean sea level. The word "mean" in this use denotes the "mathematical average". The sea rose above it and set below it by an equal amount during the tidal cycle. #2) - The mark was made in the middle of the tidal range in 1841 and it was photographed 163 years later at the bottom of the tidal cycle. #3) - the tidal cycle is one meter and the mark is 50 centimeters or one-half meter long. #4) - the mark is sitting about 30 or 40 centimeters above the water in the photograph. Given that there is some wave surge, it looks like the level of the ocean has not changed one bit in 163 years. Granted, this will not show a change of a centimeter or so but to have such a good record over 163 years and to not have any visible change surely pricks the credibility of the climate change people... We have been going through a historically recorded series of global warming and cooling cycles lasting about 400 years. We seem to be entering a warming one now. This is not man made, we don't have anywhere near the power to do this. We sure have the hubris to think that we can...
Posted by DaveH at August 3, 2005 11:51 PM
Comments
All time favorite set of 'sea-level' pictures.
Another key piece from John Daly's site is the list of evidence for a global medieval warm period.
Short version: It's been a lot hotter, please get serious.
Posted by: Al at August 4, 2005 4:51 PMPost a comment