May 12, 2009
Three interesting graphs
Dr. Roy Spencer takes a long look at CO2 and its sources and finds some interesting numbers:Global Warming Causing Carbon Dioxide Increases: A Simple Model
Global warming theory assumes that the increasing carbon dioxide concentration in the atmosphere comes entirely from anthropogenic sources, and it is that CO2 increase which is causing global warming.
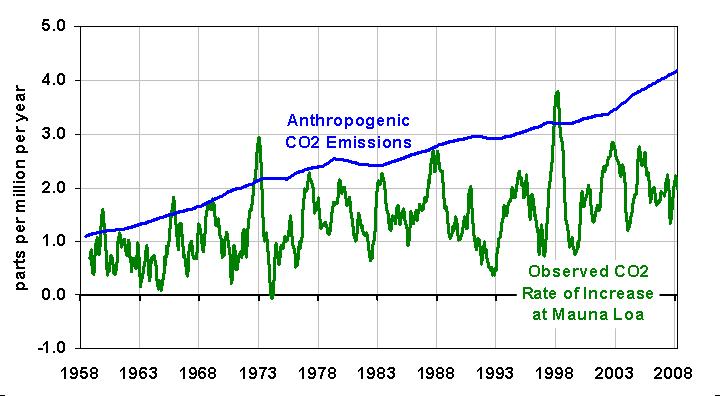
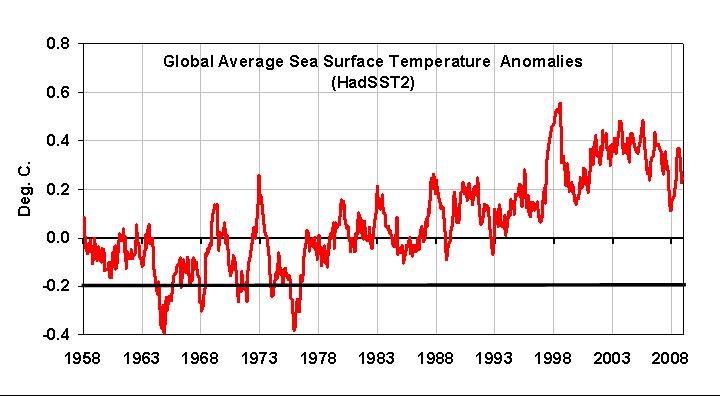
But it is indisputable that the amount of extra CO2 showing up at the monitoring station at Mauna Loa, Hawaii each year (first graph below) is strongly affected by sea surface temperature (SST) variations (second graph below).
Click for full-size...
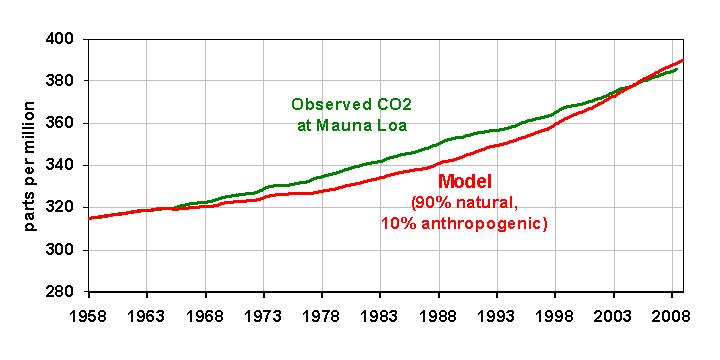
The best fit (shown) assumed only 10% of the atmospheric CO2 increase is due to human emissions (b=0.1), while the other 90% is simple due to changes in sea surface temperature. The peak correlation between the modeled and observed CO2 fluctuation is now at zero month time lag, supporting the model�s realism. The model explained 50% of the variance of the Mauna Loa observations.
The best model fit assumes that the temperature anomaly at which the ocean switches between a sink and a source of CO2 for the atmosphere is -0.2 deg. C, indicated by the bold line in the SST graph, seen in the second graph in this article. In the context of longer-term changes, it would mean that the ocean became a net source of more atmospheric CO2 around 1930.
A graph of the resulting model versus observed CO2 concentration as a function of time is shown next:
Click for full-size...